
Stock markets ended the week slightly lower – Stock markets had a relatively quiet week. Second quarter corporate profits have come in strong which was expected. Unfortunately, investors sold off stocks Friday on fears of rising COVID cases. That brought stock markets down at the close of the week. The Dow Jones Industrial Average closed the week at 34,687.85, down 0.5% from 34,870.16 last week. It is up 13.2% year-to-date. The S&P 500 closed the week at 4,327.16, down 0.7% from 4,369.55 last week. It is up 15.5% year-to-date. The NASDAQ closed the week at 14,427.24, down 1.9% from 14,701.92 last week. It is up 12% year-to-date.
U.S. Treasury bond yields – The 10-year treasury bond closed the week yielding 1.31%, down from 1.37% last week. The 30-year treasury bond yield ended the week at 1.93%, down from 1.99% last week. We watch bond yields because mortgage rates often follow treasury bond yields.
Mortgage rates – The July 15, 2021, Freddie Mac Primary Mortgage Survey reported mortgage rates for the most popular loan products as follows: The 30-year fixed mortgage rate was 2.88%, down slightly from 2.90% last week. The 15-year fixed was 2.22%, almost unchanged from 2.20% last week. The 5-year ARM was 2.47%, down from 2.52% last week.
California home prices continue to rise at record pace in June – The California Association of Realtors reported that existing home sales totaled 436,000 on a seasonally adjusted annualized rate in June. That marked a year-over-year increase of 28% in the number of sales last June. The median price paid for an existing home in June was $819,630, up from May’s $818,260 median price. Year-over-year the median price increased 30.9% from last June when the median price was $588,070. June marked a third straight month of year-over-year gains of over 30% in the median price.. The California Association of Realtors tracks inventory levels based on how many months it would take to sell the active listings in all MLS systems at the current sales level. There was a 1.7 month supply of homes for sale in June, down from a 2.7 month supply of homes for sale last June. Active listings are beginning to climb, and are at the highest level since last October.
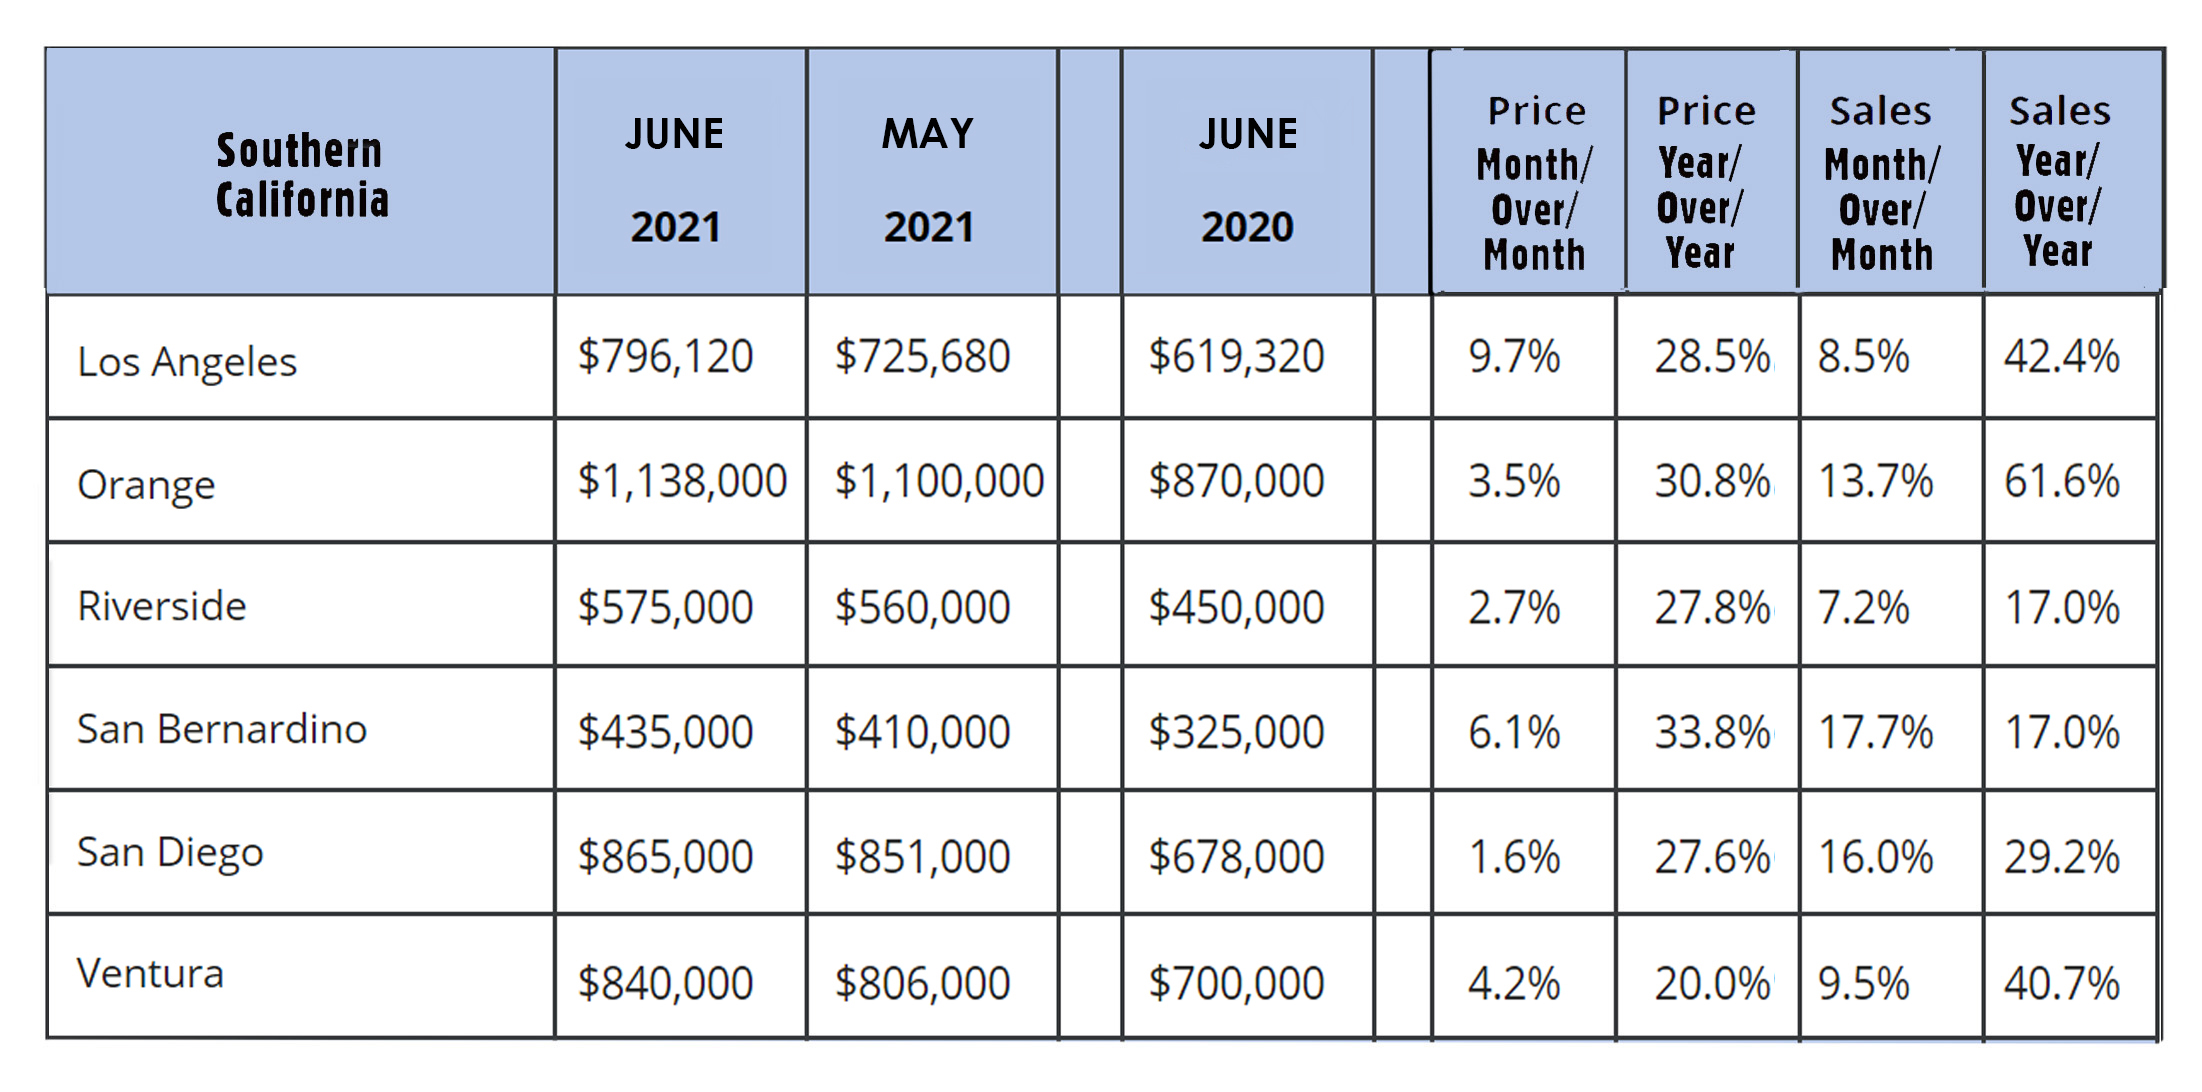
Below are median price and sales data by county.